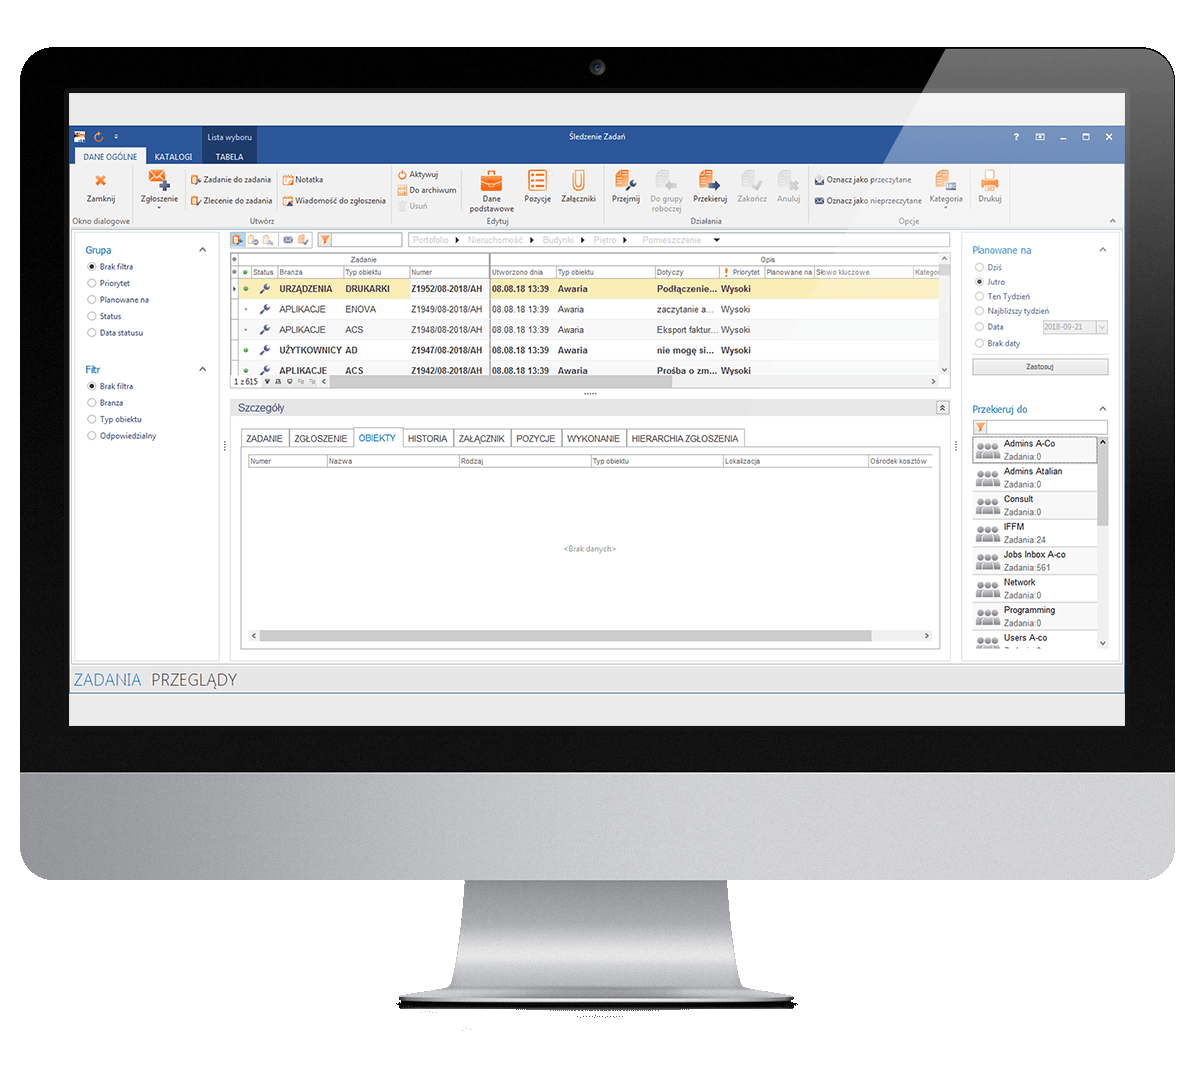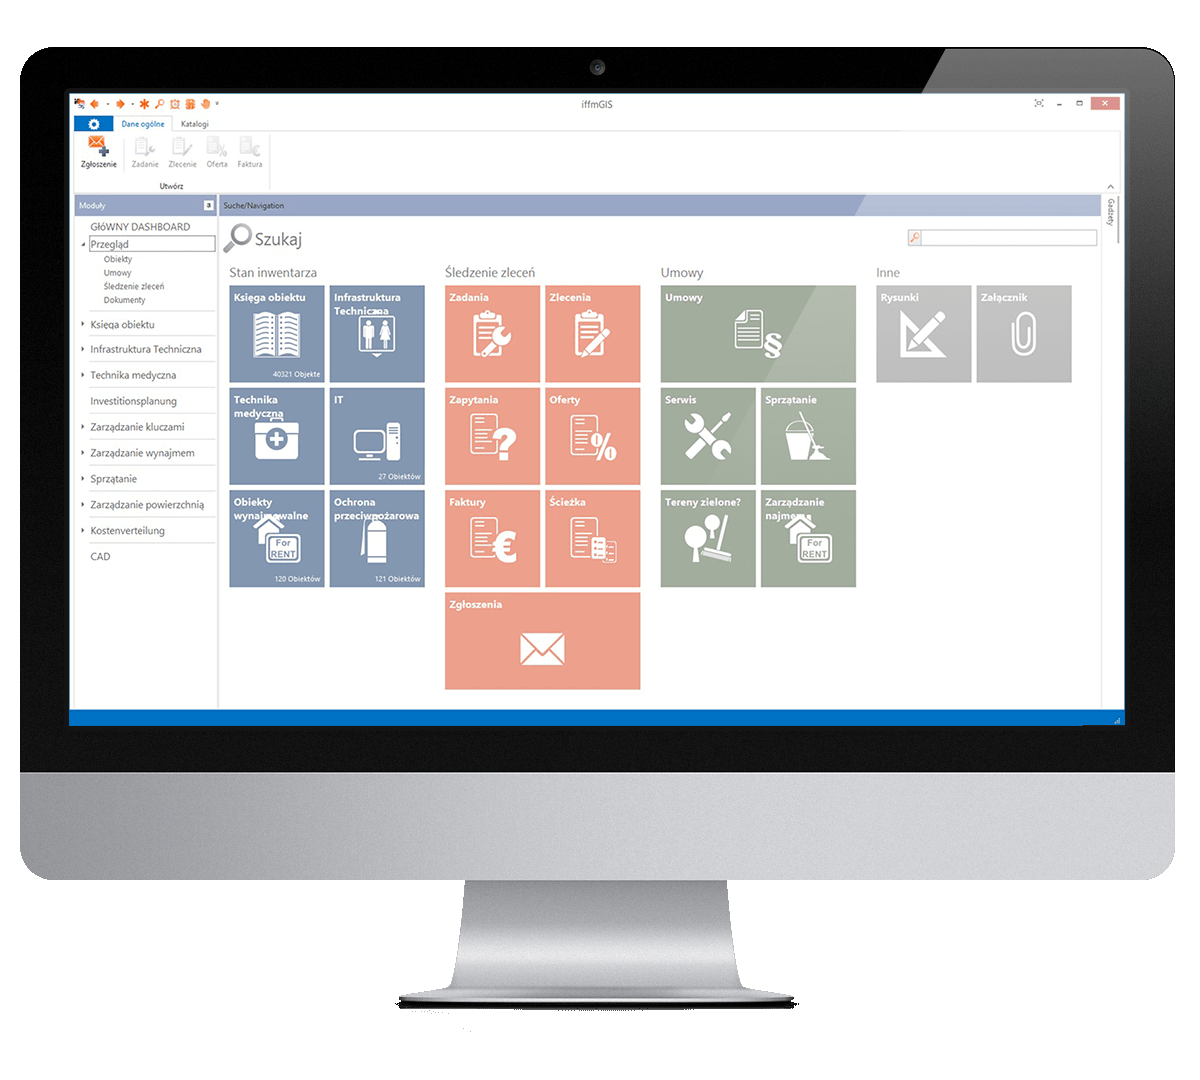
Technical maintenance includes transparent calendar of inspections and service tasks. Right dashboard showing complete information on reported failures, related orders, as well as state of allocated service tasks helps to coordinate numerous teams and complex work on often dozens or hundreds of tickets daily.
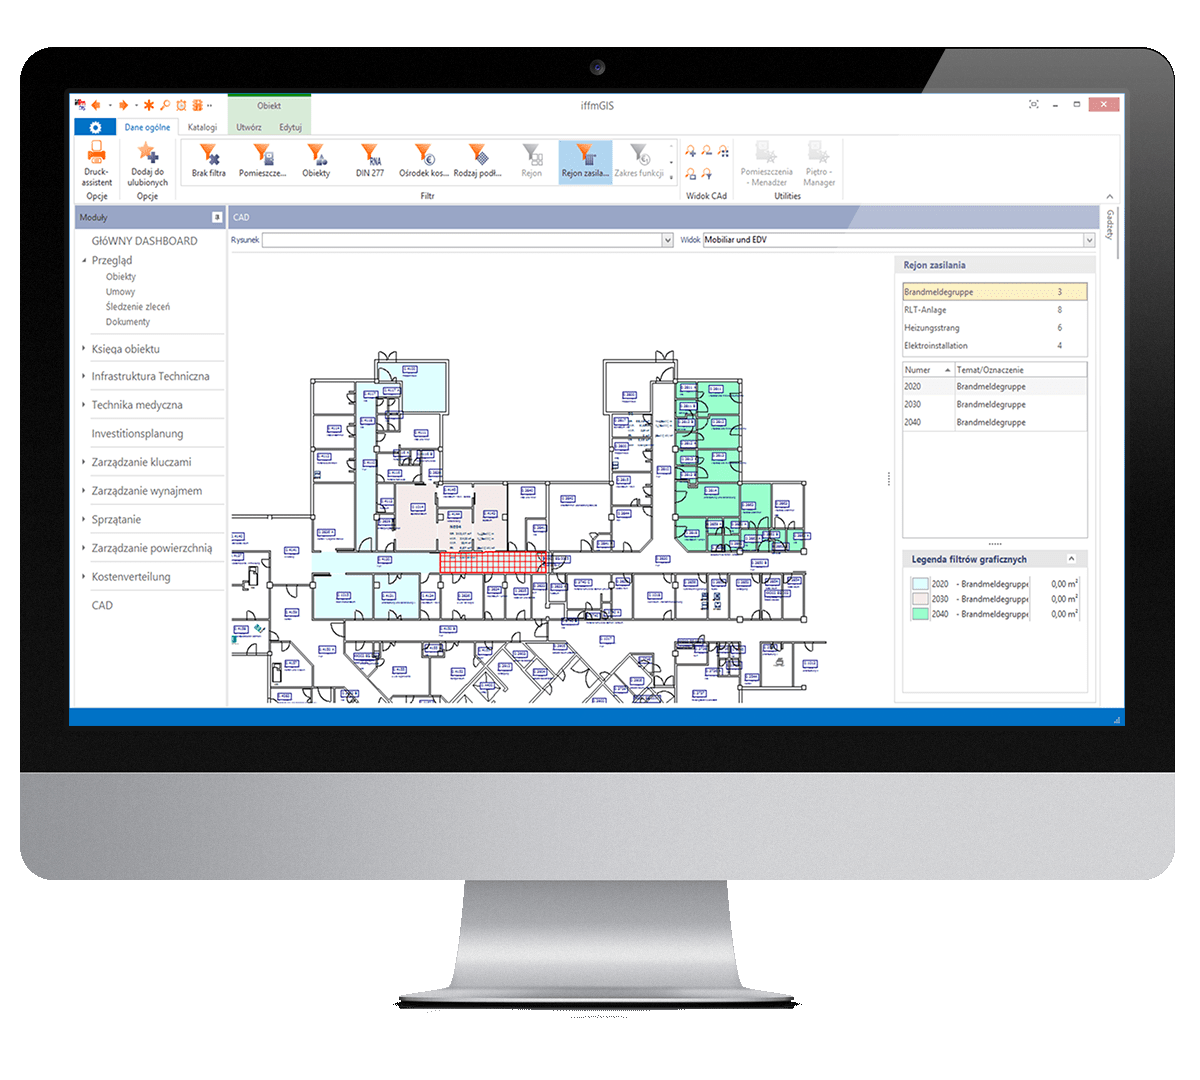
Information with ‘a click’ on the utility supply areas immensely helps to master emergency situations and need to cut-off utilities for repair.
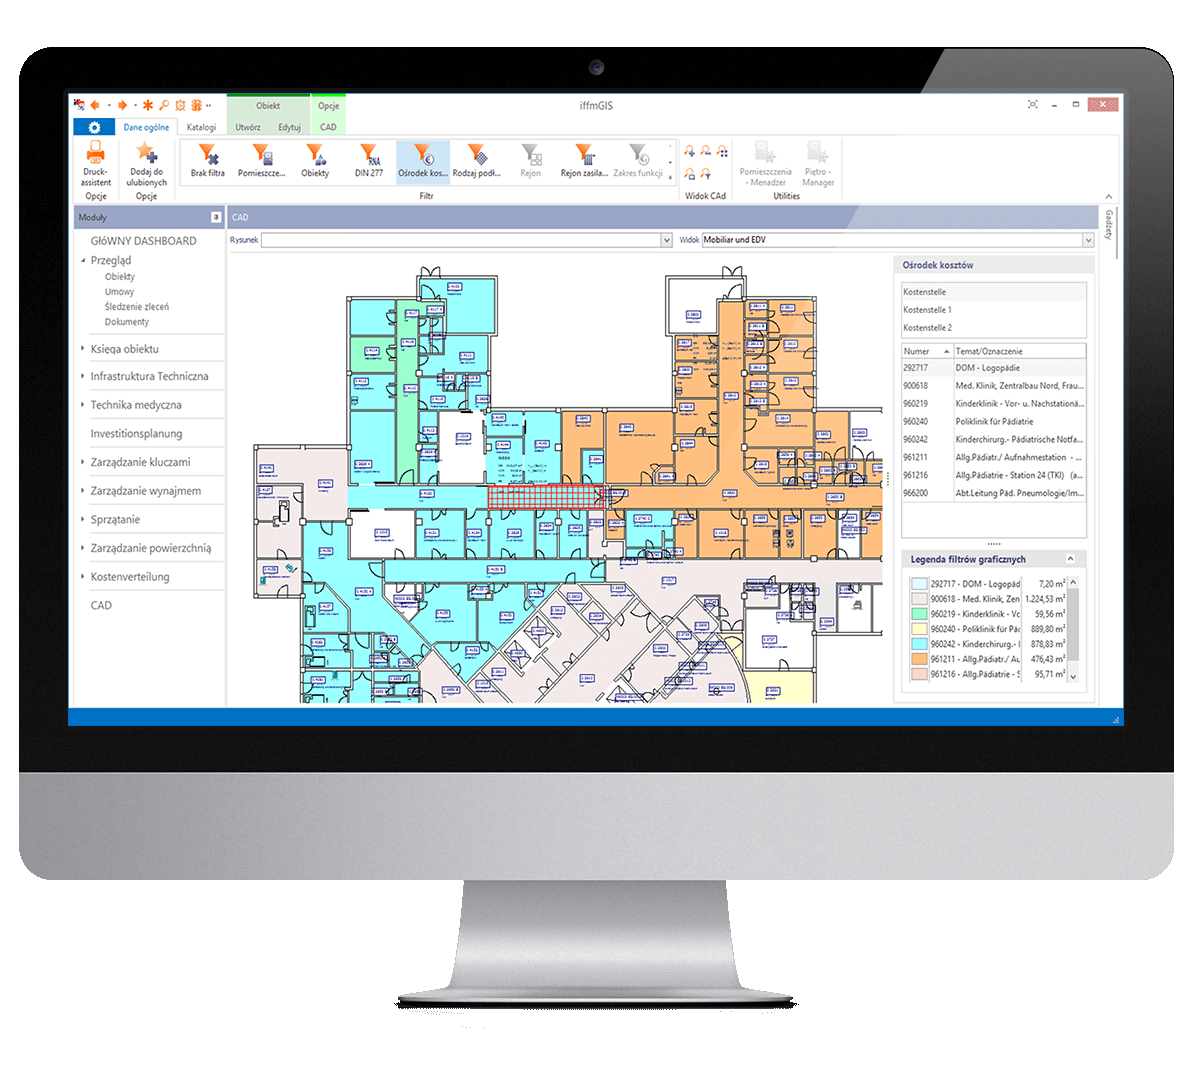
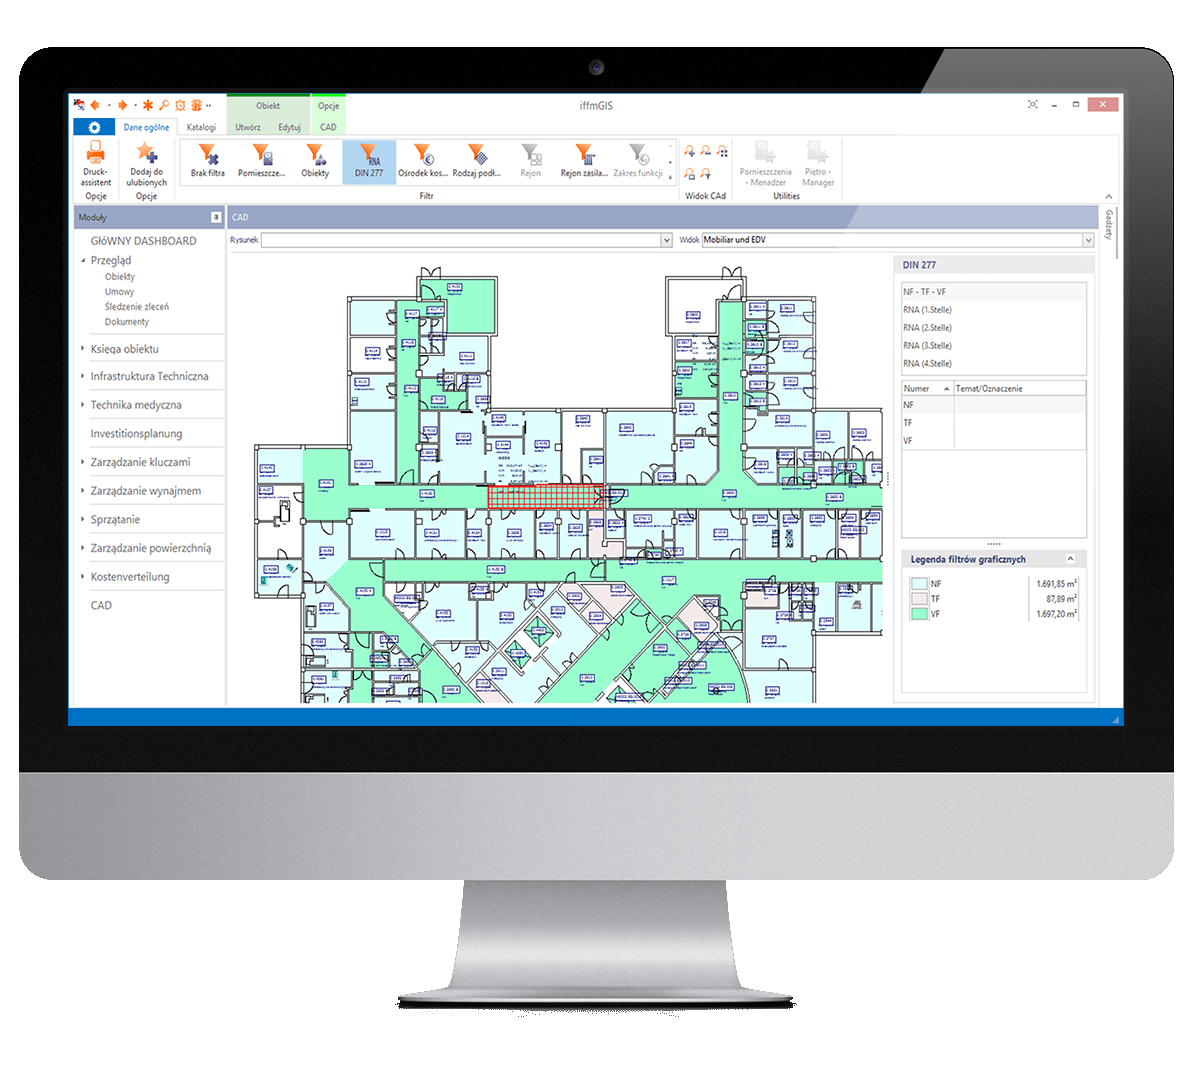
A useful feature of the iffmGIS is its ability to show spatial distribution of cost centres and comparisons between the parameters of their cost-effectiveness helping to find and test ways of optimizing space use.
Data on space use can be combined with the use categories of rooms (a German DIN classification is used by default but can be replaced by any other) . This allows one to generate any number of indices of cost, utility consumption, space-use efficiency for a given class of use or type of cost centre or building.
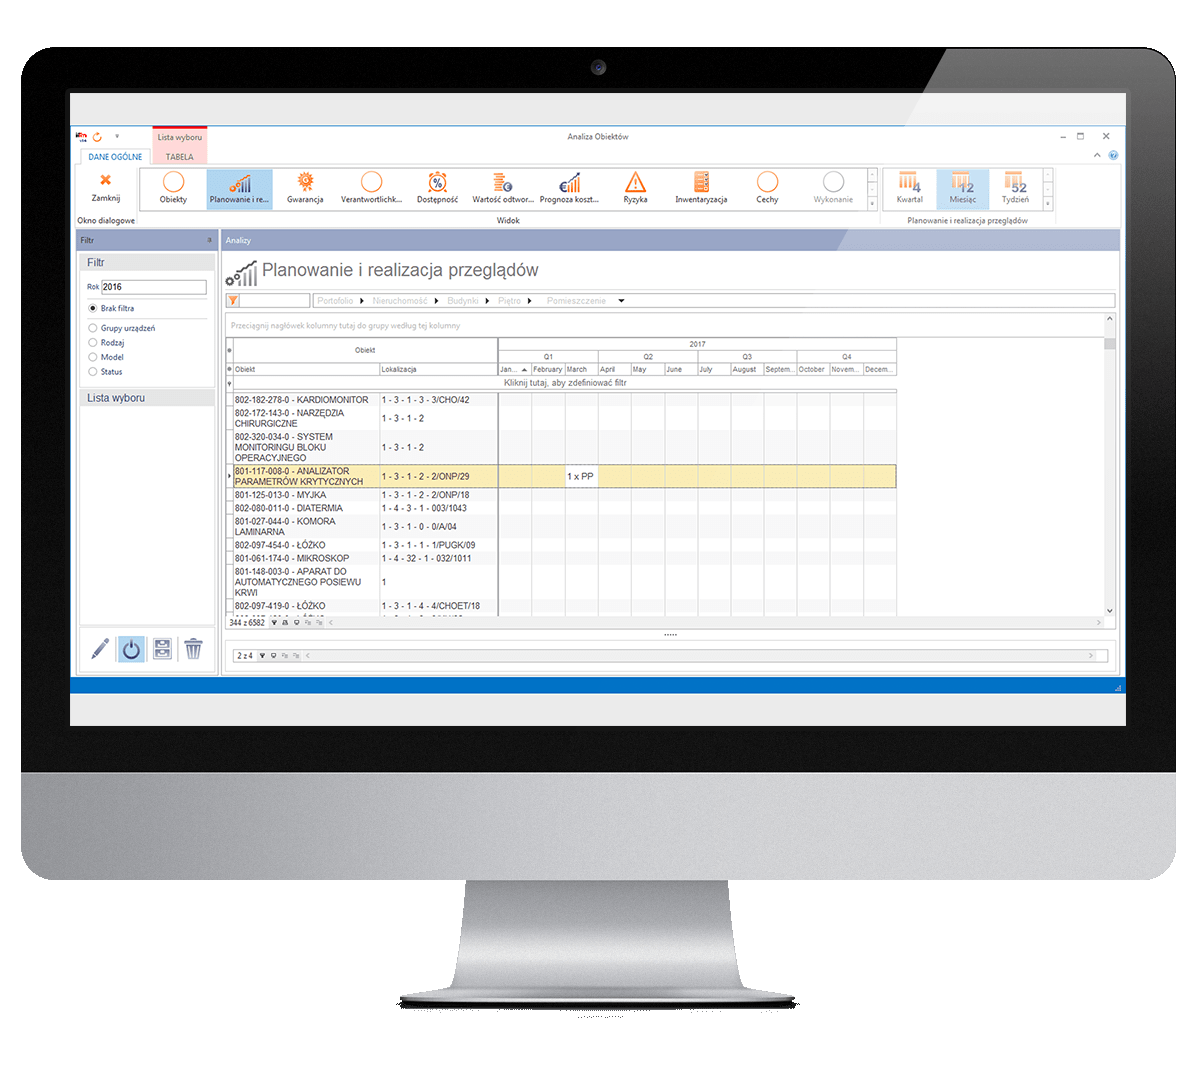
iffmGIS records events that require intervention of technical teams or external service providers. Key functionalities:
⦁ Complete documentation of events and technical interventions per piece of equipment and location.
⦁ Orders sent/received using mobile devices, including scans of bar and QR codes in order to identifie room or equipment.
⦁ Allocation of events and tasks to individual technitians or external service companies.
⦁ Tracking of work in progress.
⦁ Report generation and checks for the purpose of SLA.
iffmGIS allows management to track in real time work of technical teams: reported faults, actions of service, work in progress. Monitoring of maintenance activities is easier due to access to the application with tablet or smartphone.
